How racing is making strides into ‘Big Data’

Article by Alysen Miller

GPS tracking and stride analysis in racehorses

Unless you’ve been living under a rock, you may have noticed many male footballers wearing what appears to be a sports bra during training and matches. This is not a political statement, a show of solidarity with their female counterparts, perhaps; nor is it the latest fashion craze. Rather the bras are, in reality, GPS tracker vests. Containing a small Global Positioning System gadget, they allow team managers and trainers to collect and analyse players’ individualised GPS data in order to make informed decisions about tactics and training.

Stride analysis in horse racing

Like all big-money sports, the top football clubs now employ legions of data nerds to crunch the numbers on all aspects of their players’ performances. Premier League football club, Arsenal, uses the STATSports system to gather physical data on all their players, from the under-12s to the men’s and women’s first teams. Marketed as “the most advanced wearable tech on the market” (that’s the famous bra), it records some 250 separate metrics, including accelerations and decelerations, average heart rate, calories burned, distance per minute, high-speed running, high-intensity distance, max speed, sprints and strain. The statistics are available live during training sessions so coaches can make real-time adjustments where necessary. 

And it goes beyond wearable tech. Players at last year’s World Cup in Qatar were able to get insights into their on-field performance through FIFA’s own player app. Physical performance metrics were collected through a highly accurate in-stadium tracking system, including multiple cameras located around the pitch. These included distance covered at various speed thresholds, number of actions above 25 miles per hour (about 40 kilometres per hour), and maximum speed – all displayed on positional heat maps. Thanks to this data, we know that Kylian Mbappé hit a top speed of 35.3 kilometres per hour (about 22 miles per hour) against Poland in the round of 16. Impressive for a two-legged athlete, even if he won’t be giving the likes of Flightline or Baaeed a run for their money.

Football is following in the footsteps of baseball and American football by embracing “Big Data”. Not only does this enhance teams’ abilities to play and train, it adds another dimension to the spectator experience. Who doesn’t want to know how far their favourite player ran? Horse racing, by contrast, still relies on a mathematical speed model, Timeform, developed in the 1950s.

Stride Master combining GPS and motion capture technologies

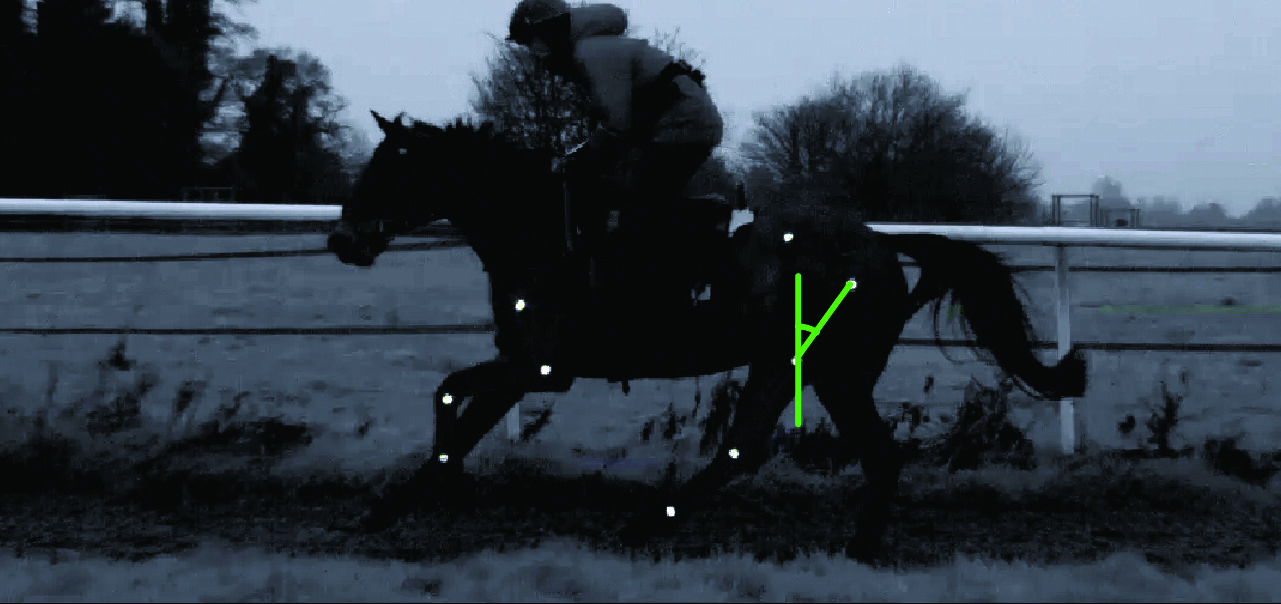
“When you look at other professional sports, racing’s a fair way behind in terms of how we measure the athlete,” says David Hawke. “Basically, we don’t measure the athlete in a biometric sense at all, whereas most other professional sports measure their athletes in competition, when the athletes are at their highest output and highest exertion. And this is the crucial point.” Hawke is hoping to change all that. He is the managing director of StrideMaster, a system that combines GPS and motion capture technologies to produce detailed insights into the horse’s performance. 

“When we developed the technology, back in 2010, it was essentially technology for race day: tracking horses, getting all their times—all the normal race track performance information that punters might want to see,” he explains. In the course of gathering this information, Hawke accumulated a treasure trove of biometric data. In 2018, he joined up with Dr David Lambert. Kentucky-based Dr Lambert is an expert on equine physiology and the founder of a company called Equine Analysis Systems, which leverages this understanding of how the horse moves to select elite, high-performance thoroughbreds. 

He is looking for the top one percent, the cream of the crop. Hawke’s idea was to take this hypothesis and turn it on its head; in other words, to find the one percent “who were in trouble.” In this way, by identifying the horses that are trying to cope with a problem, vets and trainers would have a crucial data point which could be used to help prevent injuries before they happen.

Motion tracking horses pre-sales and in racing

So how does it work? Here comes the science part. Essentially, every horse has a unique stride “fingerprint.” Thanks to Hawke’s data, we not only know what that fingerprint looks like, but also when the horse deviates substantially from that fingerprint.

 The first step is to collect high-resolution data of the horse at the gallop. This is because, as prey animals, horses are disinclined to show lameness at the walk or trot (the traditional way of assessing a horse’s soundness). “The forces that are at play when a horse is going at 40 miles per hour compared to when it’s being trotted up at five miles per hour are completely different,” says Hawke. “The price that the horse pays for going fast is that it gives up autonomy over a number of things,” he continues. “It gives up autonomy over its breathing, for example. It becomes a mechanical breather. It also gives up autonomy over its footfall. If it’s got a raging foot abscess at the walk or the trot, it will decide not to put its foot down. But at the gallop, it can’t do that. It has no choice over when it puts each foot down. So the only option it’s got left to manage an issue that’s impacting it is postural change: it’s going to hold itself differently; it’s going to use different muscles to try and take the pressure off.” 

TrojanTrack analysing horses strides to reduce injury

To capture these changes, samples are taken from three axes: the vertical, the longitudinal and the medial. This data is captured by a device about the size of an iPhone that’s slipped into the saddle cloth. These samples are then broken down further: “We split the stride up into three parts,” Hawke explains. “We have the hind leg stance phase, which is the primary propulsion and power source for the horse. Hind leg spring function is absolutely critical to a good stride, so if anything’s wrong at the back end, that immediately gets transferred to the front end on the corresponding diagonal. Then we have the forelimb stance phase. And then we have the flight phase, or the collection phase, when the horse is off the ground. The flight phase is where the horse is making most of its postural adjustments in the air. So if it’s got a problem it’s managing, it’s trying desperately to accommodate that problem during the stride. And then when it goes into the air, it’s trying desperately to get itself ready for the next stride to do it all over again.”

TrojanTrack computerised technology

The system is capable of detecting minute variations in the horse’s stride that are effectively invisible to the human eye. “From an observational point of view, humans can’t detect these sorts of changes that we’re picking up. It’s simply happening too fast,” he says. The sample rate in StrideMaster’s sensors is 800 hertz, or 800 frames per second. The human eye, by contrast, cannot directly perceive more than about 60 frames per second. “That enables us to look at the stride in a very high level of detail,” he says. 

Hawke has accumulated so much data that it’s no longer necessary to have historic data on an individual horse in order to make a judgement about its soundness. Rather, there exists an “ideal” fingerprint for different categories of horse: “We have a Gp.1 fingerprint, we have a Gp.2 fingerprint, right down to a $10,000 claimer fingerprint, to use the American parlance,” he explains. In other words, soundness can be assessed against an ideal archetype. If a horse is more than two standard deviations outside of this ideal, that is considered an adverse change that the system then flags for the attention of the trainer.

Data analysis on lower limb of horses

So how is this “deviation” measured? “We’re tracking two or three things that are important: we’re tracking the amount of power they produce, and we’re tracking the amount of vibration they produce,” Hawke explains. Vibration is, essentially, any rapid change in acceleration. That is what is most likely to cause injury. Think of the horse as a four-cylinder engine, with the legs as the pistons. Each piston—or leg—moves in a set rhythm. As long as this rhythm is maintained, vibration will be kept to a minimum. But changes in rhythm (for example, because the horse is managing a problem) generate vibration which, in turn, generates damage. The sounder the horse, in other words, the less vibration. But with great power comes the potential to generate huge amounts of vibration. This explains why most of the horses that get flagged are competitive horses in whatever cohort they’re in. “They’re not horses that are running 20 lengths down the track,” says Hawke. “Generally, those horses are not producing enough power or vibration to get themselves into trouble. [The good horses] will always find a way to go fast,” he says.

While Hawke sees the technology primarily as an injury prevention tool, he acknowledges that its potential is broader than that: “From a social licence point of view, that’s where the pressure is: to manage these injury rates and welfare outcomes better than we have been. So that’s the primary focus,” he says. But the same technology could, in theory, be used to identify future elite performers: 

“When you compare, say, a Gp.1 horse to a low-rating handicapper, what we see is increased deviation from optimum,” he explains. “To take a metric at random: gravity. The acceleration of an object toward the ground caused by gravity alone, near the surface of Earth, is called ‘normal gravity,’ or 1g. This acceleration is equal to 32.2 ft/sec2 (9.8 m/sec2). If you drop an apple on Earth, it falls at 1g”. 

“The Gp.1 horse will be much closer to that 1g than the lower rating handicapper,” he explains. “[The lower-rated horse] is not as efficient. They’re losing power in all directions. They’re going up and down more, they’re going side to side more. Whereas the elite horse actually generates surprisingly less power, but it’s all pointing down the road in the right direction.”

Hawke is keen to emphasise that he is not marketing a diagnostic tool. Rather, trainers should see this technology as another tool in their toolkit: “When the trainer gets the information, either they come and seek more information or talk to their vets about what’s going on. The vet can review the stride on a stride-by-stride basis. And when we get down to that level of detail, we can actually, on most occasions, give some indication of what quadrant the problem is emanating from.”
But what if you could identify such problems without even galloping the horse? 

Stephen O’Dwyer thinks he has a solution. O’Dwyer is the founder of Irish start-up TrojanTrack, which uses video cameras to record the horse at the walk and, from there, identify any variations in its movement. “We take video data of 52 different parts of the horse at 120 frames per second,” he explains. “We then convert those parts into biomechanical data: joint velocities, accelerations, angles. And then we can compare that to the horse’s healthy baseline movement to track any deteriorations or imbalances that might be creeping in.” But wait. Horses are prey animals. Won’t they naturally try to mask any injuries at the walk? “Horses are herd animals, so rather than show any sign of injury, they try to hide it as much as possible, and that means compensating on a different limb or something like that,” O’Dwyer acknowledges. “But because we’re tracking 52 points, we’re able to pick up any tiny deviations, tiny nuances that won’t be picked up by the human eye. 

“In talking to a few of the vets, they say that when the horse is in its walk, it’s at its most comfortable,” he continues. “And because they’re in their most comfortable state, they won’t be trying to hide their injury as much.” O’Dwyer plans to incorporate trot movements in the future.

Motion tracking Thoroughbred racehorses

Like Hawke, O’Dwyer sees his technology primarily as another arrow in the trainer’s quiver, rather than a diagnostic tool. “It’s hard for the trainer to pick up on the whole horse at once,” he explains. “They might be staring at one limb while the hip isn’t moving, and they’d have to walk by again and check the hip, and then they’re not looking at another limb. We look at all four limbs landing, the hip movement as one of the limbs is landing. So it’s the whole package of the horse in one to really show the trainer exactly what is going on.”

O’Dwyer acknowledges that the technology is still in its nascency. He is currently running customer trials a couple of yards in Ireland while he tries to drum up the next round of investment. StrideMaster, meanwhile, has been adopted by racing authorities in the United States and in Hawke’s native Australia. But any technologies that can help spot potentially catastrophic injuries before a horse hits the track must be taken extremely seriously by an industry that can, at times, feel like it is operating on the razor’s edge of public acceptability. As Hawke says, “The first priority is welfare because we have to look after the animal. If we’re not seen to be looking after the animal, the whole game’s in trouble.”

It seems like it is only a matter of time before racing joins the ranks of other sports in embracing Big Data. Says Hawke: “If I walked into a major football club and said, ‘Who here’s got expertise in biometric sensor analysis,' half the football department would put their hand up because they’ve been doing it for 20 years. But the information can be used in so many different ways in terms of performance, breeding and training techniques. We’re just scratching the surface.”

How technology can quantify the impact saddles have on performance

How technology can quantify the impact saddles have on performance[OPENING PIC – half tree.jpg][STANDFIRST]Thanks to advances in technology, it is getting easier for scientists to study horses in a training environment. This, combined with recent sa…

By Dr. Russell Mackechnie-Guire

Thanks to advances in technology, it is getting easier for scientists to study horses in a training environment. This, combined with recent saddlery developments in other disciplines, is leading to significant progress in the design and fit of exercise saddles.

Back pain, muscle tension and atrophy are common issues in yards. Although there are many contributory factors, the saddle is often blamed as a potential cause. Unlike other equestrian sports, where the effect of tack and equipment on the horse has been investigated, until now there has been little evidence quantifying the influence of exercise saddles.

New era

The technological advances used in sport horse research are sparking a new era in racing, enhancing our understanding of the physiological and biomechanical demands on the horse, and helping improve longevity and welfare. For the trainer this translates into evidence-based knowledge that will result in marginal or, in some cases, major gains in terms of a horse’s ability to race and achieve results. Race research has always been problematic, not least due to the speed at which the horse travels. Studies have previously been carried out in gait laboratories on treadmills, but this is not representative of normal terrain or movement. Thanks to new measuring techniques, we can now study the horse in motion on the gallops. Evidence of this new era arises from a recent study published in the Journal of Equine Veterinary Science. It found areas of high pressures under commonly used exercise saddles which had a negative influence on back function, affecting the horse’s gallop and consequently performance. 

The pressure’s on

Researchers used a combination of pressure mapping and gait analysis (see Technology in focus panel) to investigate three designs of commonly used exercise saddles: full tree, half tree and three-quarter tree. The aim was to identify pressure magnitude and distribution under each of the saddles then to establish whether the gait (gallop) was improved in a fourth saddle designed to remove these pressures. 

Areas of high pressure were found in the region of the 10th-13th thoracic vertebrae (T10-T13). Contrary to popular belief, none of the race exercise saddles tested in this study produced peak pressure on or around the scapula. The pressures around T10-T13 at gallop in the half, three-quarter and full tree were in excess of those detected during jumping or dressage in sport horses. They were also higher than pressures reported to be associated with clinical signs of back pain. Therefore, it is widely accepted that high pressures caused by the saddle could be a contributory factor to back pain in horses in training.  

Three most commonly used saddle-tree lengths, plus the new design (purple 40cm)

Three most commonly used saddle-tree lengths, plus the new design (purple 40cm)

Half tree: High peak pressures in the region of T10-T14 were consistent with the end of the tree.Three-quarter tree: Peak pressure was localised on one side of the back at a time, depending on the horse’s gallop lead.Full tree: Peak pressure was fur…

Half tree: High peak pressures in the region of T10-T14 were consistent with the end of the tree.

Three-quarter tree: Peak pressure was localised on one side of the back at a time, depending on the horse’s gallop lead.

Full tree: Peak pressure was further back and, although not high, gait analysis demonstrated a reduction in the extent to which the hindlimb comes under the horse, reducing the power in the stride.

New design: A more uniform pressure distribution, recording the lowest peak pressures at each location.

Lower pressure leads to longer strides

When looking at propulsion, there are two important measurements: the angle of the femur relative to the vertical and hip flexion. When pressures were reduced beneath the saddle, researchers saw an increased femur-to-vertical angle in the hindlimb and a smaller hip flexion angle (denoting the hip is more flexed).

A greater femur-to-vertical angle indicates that the hindlimb is being brought forward more as the horse gallops.

A greater femur-to-vertical angle indicates that the hindlimb is being brought forward more as the horse gallops.

A smaller hip flexion angle denotes the hip is more flexed, allowing the horse to bring his quarters further under him and generate increased power.

A smaller hip flexion angle denotes the hip is more flexed, allowing the horse to bring his quarters further under him and generate increased power.

Improved hip flexion was recorded in the new saddle design (A) compared to a commonly used saddle (B).

Improved hip flexion was recorded in the new saddle design (A) compared to a commonly used saddle (B).

When pressure is reduced in the region of T13, the hindlimb is allowed to come more horizontally under the horse at this point in the stride, leading to an increase in stride length. Researchers speculate that this could be due to the fact that the thorax is better able to flex when pressure is reduced.

Perhaps surprisingly, the study found that reducing saddle pressures did not result in any significant alteration in the forelimb at gallop. The major differences were recorded in hindlimb function. This could be explained anatomically; the forelimb is viewed as a passive strut during locomotion, whereas the hindlimbs are responsible for force production.

This is consistent with findings in the sport horse world, where extensive research investigating pressures in the region of the 10th-13th thoracic vertebrae has shown that reducing saddle pressure is associated with improved gait features in both dressage and jumping. 

Speed matters…

BUY THIS ISSUE IN PRINT OR DOWNLOAD

January - March 2020, issue 68 (PRINT)
£8.95
Quantity:
Add to Cart

WHY NOT SUBSCRIBE?

DON'T MISS OUT AND SUBSCRIBE TO RECEIVE THE NEXT FOUR ISSUES!

IF YOU LIKE THIS ARTICLE

WHY NOT SUBSCRIBE - OR ORDER THE CONTENT FROM THIS ISSUE IN PRINT?

Finding Owners

First Past the Post Millennials: as the younger generation of trainers comes of age, could they teach the old guard a thing or two about attracting and retaining new owners to the sport? As the racing industry collectively seeks to recruit a younger…

By Alysen Miller

Millennials: as the younger generation of trainers comes of age, could they teach the old guard a thing or two about attracting and retaining new owners to the sport? As the racing industry collectively seeks to recruit a younger, more diverse demographic, and trainers are having to get increasingly creative in order to entice new owners into the sport, it is the trainers of the social media generation who are taking the reins.

The best way to make a small fortune in racing, so goes the proverb, is to start with a large fortune. But how large? £22,595, to be exact. According to the Racehorse Owners Association, that was the average cost of owning a flat racehorse in the UK in 2017 (the last year for which figures are available); and that’s before entry fees, veterinary bills and insurance are factored into the equation. Based on a horse’s running an average of 7.4 times a year, that gives a ‘cost-per-run’ of £3,053—in other words, a snip at £20 per second. Translated into Millennial parlance, that’s a lot of pieces of avocado toast. In short, you don’t have to be royalty to participate in the sport of kings, but it helps. So where do trainers find a pool of people willing to submit their bank balance to this particular kind of reverse equine alchemy?

Robert Cowell

Robert Cowell

The answer—as for where you turn when you want to find out what type of sandwich you are based on, your star sign or who would play your best friend in the movie of your life—is social media. Increasingly, trainers are turning to Facebook, Instagram and Twitter to advertise their wares to the wider world. These days, seemingly every trainer—Millennial or not—and his dog have a social media account (just ask the latest star of the Twittersphere, Jamie Osborne’s infamous whippet, Bad Bobby). “I think Facebook, Twitter and Instagram certainly help reach a larger audience”, says the decidedly non-Millennial Robert Cowell who, at 50, would doubtless be the first to admit that he is more au fait with winning posts than Facebook posts. “A lot of people that we have engaged with are very interested in the day-to-day life of what goes on in a racing yard. Short videos and little pictures every now and again—just giving them an update of what we do—is certainly no skin off our nose, and if it helps people to understand our industry, then I think it’s a very good thing”.

But though the tools at today’s trainers’ disposal may be relatively new-fangled, it remains to be seen just how novel this approach is in reality. From social media to syndicates, trainers have always sought new avenues to bring racehorse ownership to a wider public and diversify their portfolio of owners. Now a common sight on racecourses throughout Europe and, indeed, the world, the first syndicates in the UK were set up by Kennet Valley Thoroughbreds and then Highclere Racing more than 20 years ago. Today, Highclere is one of the largest manager of syndicates in Europe, where syndicate ownership is increasingly popular even as sole ownership is declining. In the UK alone, 5,447 people participated in ownership via syndicates or other shared ownership schemes in 2018—an increase of 6.2% year-on-year. Compare that with a 1.4% drop in sole ownership over the same period. So what is it about the communal approach that appeals to owners? The most obvious answer is the price: for a fraction of the cost of owning a racehorse outright, a syndicate member can rub shoulders with the Queen and Sheikh Mohammed in owners’ enclosures from Ascot to York. Yet the calibre of some of the celebrity clientele (high-profile syndicate members have included Sir Alec Ferguson, Elizabeth Hurley and Carol Vorderman, who can surely be counted upon to have done the math) belies the theory that cost alone is behind syndicates’ popularity.

Indeed, research shows that the satisfaction rating for syndicate members is 8.2 out of 10, compared to 7.5 out of 10 for sole owners, according to a 2016 survey undertaken by sports marketing agency Two Circles on behalf of the ROA and the BHA. Instead, the suggestion is that syndicate ownership appeals to civilians and celebrities alike because it confers a sense of being a part of something larger than oneself; of belonging to a community with whom to share in the highs and lows—in other words, that sounds rather a lot like a social network (Mark Zuckerberg, eat your heart out). So why not go all out for syndicates and the relative security they provide, rather than putting all one’s eggs in the gilded baskets of capricious individual owners?

Edward Bethell

Edward Bethell

“I think syndicates are a great thing”, says Edward Bethell who, at 26, sits squarely in the ‘digital native’ demographic. “I think trainers should do more of it. But then syndicates are a full-time job in themselves because you need someone to manage them. People need to be updated regularly”. So where does Bethell think trainers, and particularly young trainers, should focus their efforts? “I’m a big believer in social media. I think it gets you out there.

For a smaller trainer or for a young guy, you’ve got to create a niche in the market for yourself. I think social media can only be a good thing as long as you’re using it in a positive way”. Bethell, who has worked in Australia for Gai Waterhouse and sojourned for a stint in France, has overhauled his father’s social media profile and is making a name for himself as something of a social media maven.

TO READ MORE —

BUY THIS ISSUE IN PRINT OR DOWNLOAD

April - June 2019, issue 65 (PRINT)
£8.95
Quantity:
Add to Cart

WHY NOT SUBSCRIBE?

DON'T MISS OUT AND SUBSCRIBE TO RECEIVE THE NEXT FOUR ISSUES!

Part I: The Thoroughbred Trainer in the Digital Age

Published in European Trainer, January - March 2018, issue 60.

This is the first article in a two-part series on social media for thoroughbred trainers. It examines social media usage and issues faced by trainers who wish to promote their business online. Part II will focus on broader industry issues and how trainers may use social media to affect positive change and ensure the future of the sport.

In less than 15 years, social media has changed the way we meet, work, shop, communicate, consume news and entertainment, find romance, and more. Few aspects of our lives have been left untouched by this remarkable phenomenon. Social media has made a limited group of people incredibly wealthy, empowered others to create new businesses or expand existing ones, and made various individuals famous or infamous.

Simply defined, social media consists of online networks that allow users to connect, create, communicate, and share in virtual communities. And we cannot seem to get enough.

• 73% of Europeans use some type of social media.

• 41.7% of Europeans use Facebook, the most popular social media platform.

• Many Europeans, including three-quarters of Facebook users, log onto social media sites as part of their daily routine.

• Most European social media users utilize more than one social media platform.

• The growth of social media is likely to remain steady for years to come.

As a trainer, you may be one of the hundreds of millions of Europeans who is familiar with the ins and outs of social media. You may be an occasional, routine, or even heavy user.

Alternatively, you may be a hold-out who is too busy or privacy-oriented. Regardless of your personal opinion of social media, it is worthwhile to step back and examine how social media may assist in expanding your training business, or, alternatively, present potential risks including both civil liability and criminal violations.

As a trainer, unless you have a full roster of owners, it is wise to have a social media presence to promote your business. Consider the many positives:

Getting Found.....

To read more - subscribe now! 

IF YOU LIKE THIS ARTICLE

WHY NOT SUBSCRIBE - OR ORDER THE CONTENT FROM THIS ISSUE IN PRINT?

Michael Hourigan - The Gadget Man

CLICK ON IMAGE TO READ

Equine lameness - Can it be measured?


CLICK ON IMAGE TO READ ARTICLE

IF YOU LIKE THIS ARTICLE

WHY NOT SUBSCRIBE - OR ORDER THE CONTENT FROM THIS ISSUE IN PRINT?

All in the genes - can a racehorses potential be found through genetic testing?

CLICK ON IMAGE TO READ ARTICLE

IF YOU LIKE THIS ARTICLE

WHY NOT SUBSCRIBE - OR ORDER THE CONTENT FROM THIS ISSUE IN PRINT?

Training with More Precision - how technology can help train a racehorse

CLICK ON IMAGE TO READ ARTICLE

Bill Pressey (16 July 2009 - Issue Number: 13)

IF YOU LIKE THIS ARTICLE

WHY NOT SUBSCRIBE - OR ORDER THE CONTENT FROM THIS ISSUE IN PRINT?